

Learn how to read your campaign’s Statistics tab, review call history, and export call and survey data.
Every AI Sales Dialer campaign has a built-in Statistics tab so you can see how it’s performing without leaving the Dashboard. Open a campaign and click Statistics. You can filter everything on the page by time period using the dropdown in the top right (default: All time).
Overview cards
Four cards sit at the top of the page:💡 Dropped percentage is an exhaustion rate, not a count of dropped or disconnected calls.

Funnel
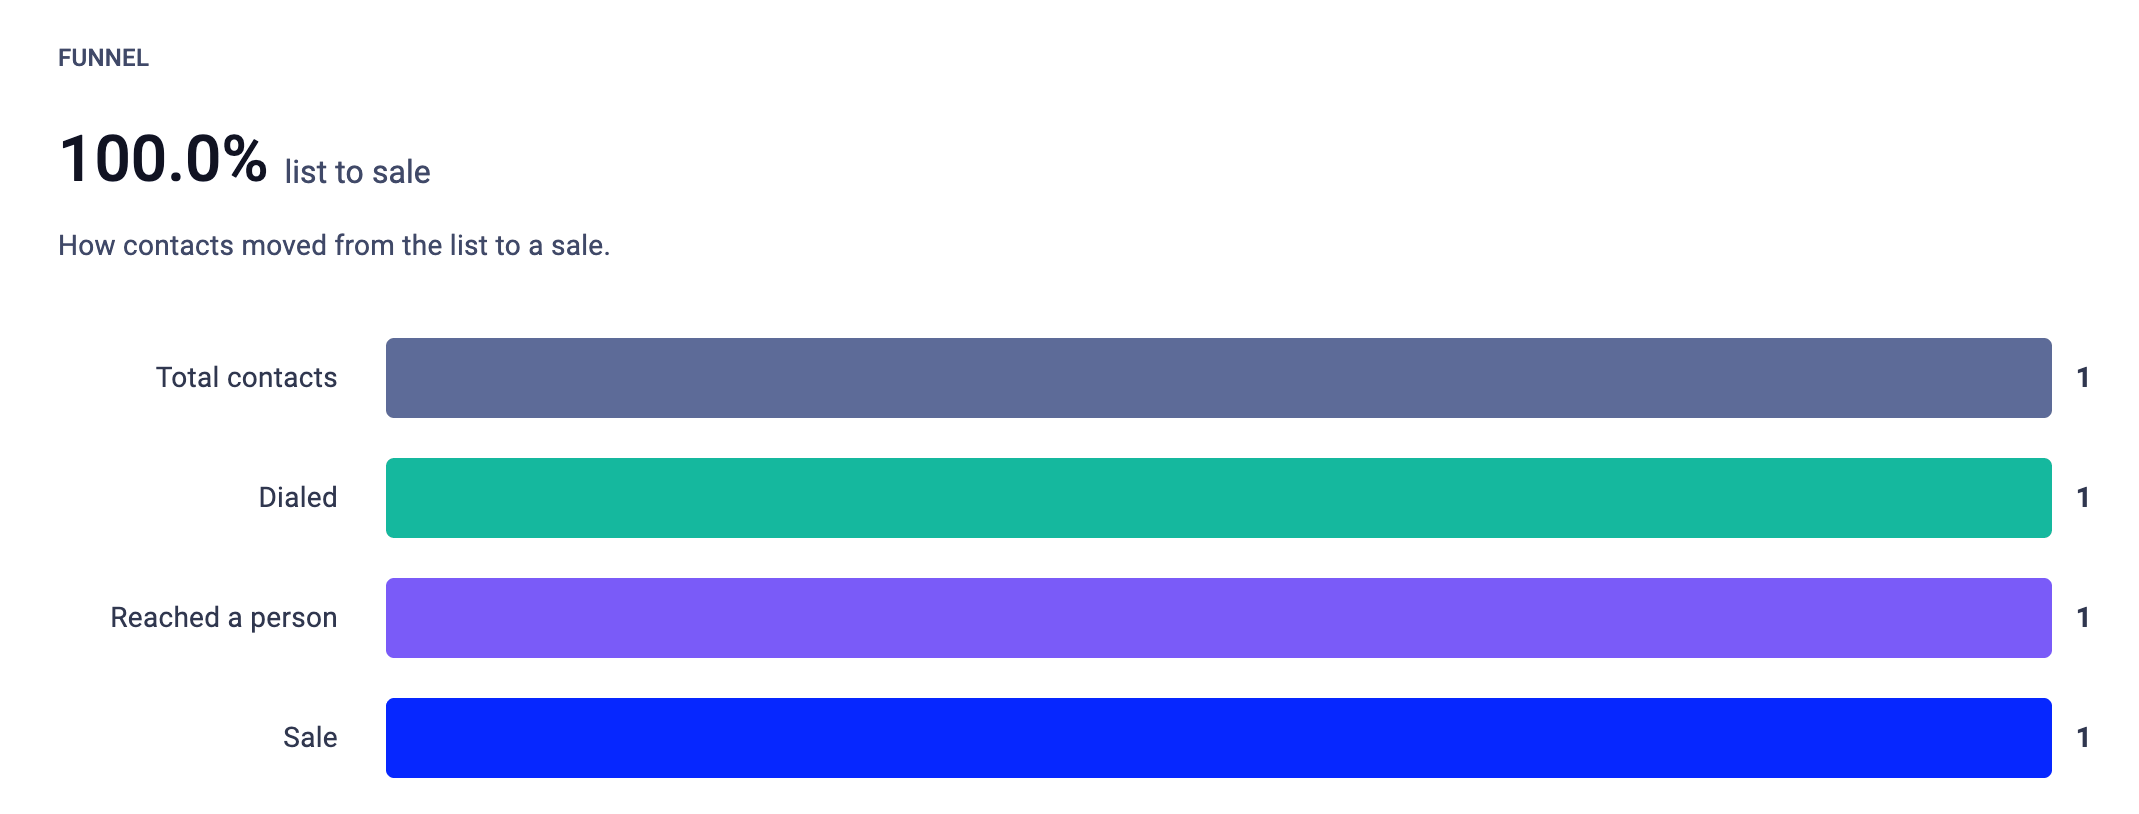
The funnel shows how contacts move through the campaign from list to sale:- Total contacts: everyone in the campaign.
- Dialed: contacts where at least one call was placed.
- Reached a person: calls answered by a human (not voicemail or machine).
- Sale: contacts who reached a positive/conversion outcome.
Outcomes
A donut chart showing how dispositioned calls broke down by outcome type (e.g., “Failed, Call Later,” “Interested,” “Sale”). Switch the view using the By type dropdown. The center of the chart shows the total Dispositioned calls count. The percentage at the top shows what share of all calls in the selected timeframe carried an outcome.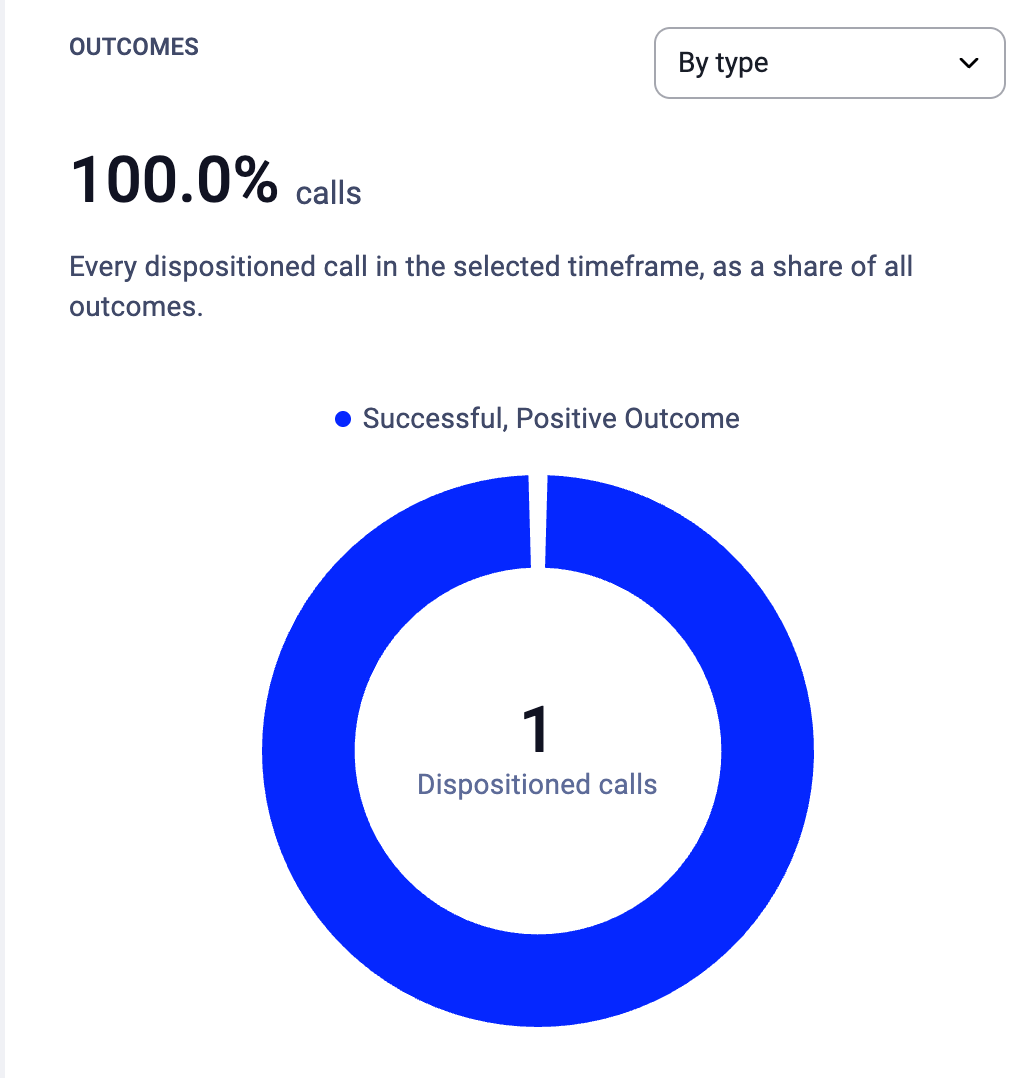
How calls were answered
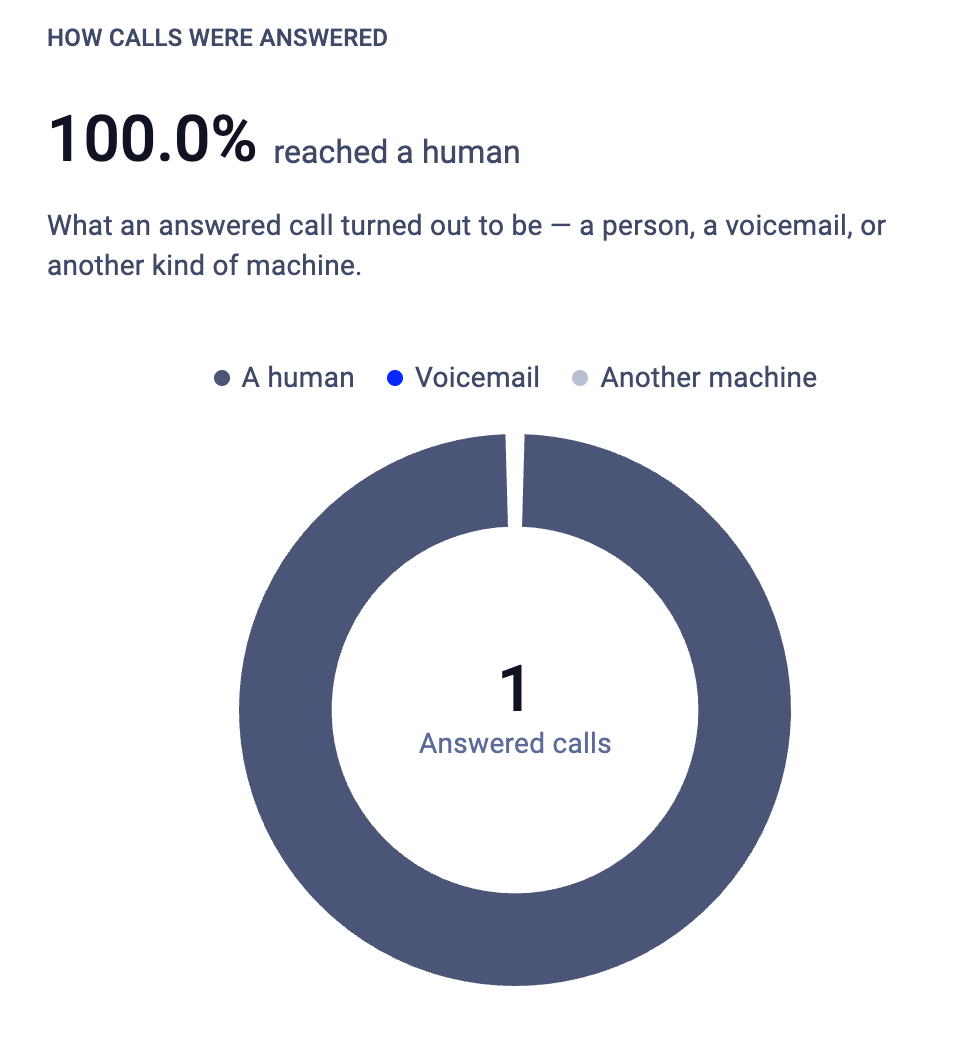
A donut chart breaking down what answered calls turned out to be:- A human: a real person picked up.
- Voicemail: the call reached an answering machine.
- Another machine: IVR, automated screener, or other non-human pickup.
Call stats
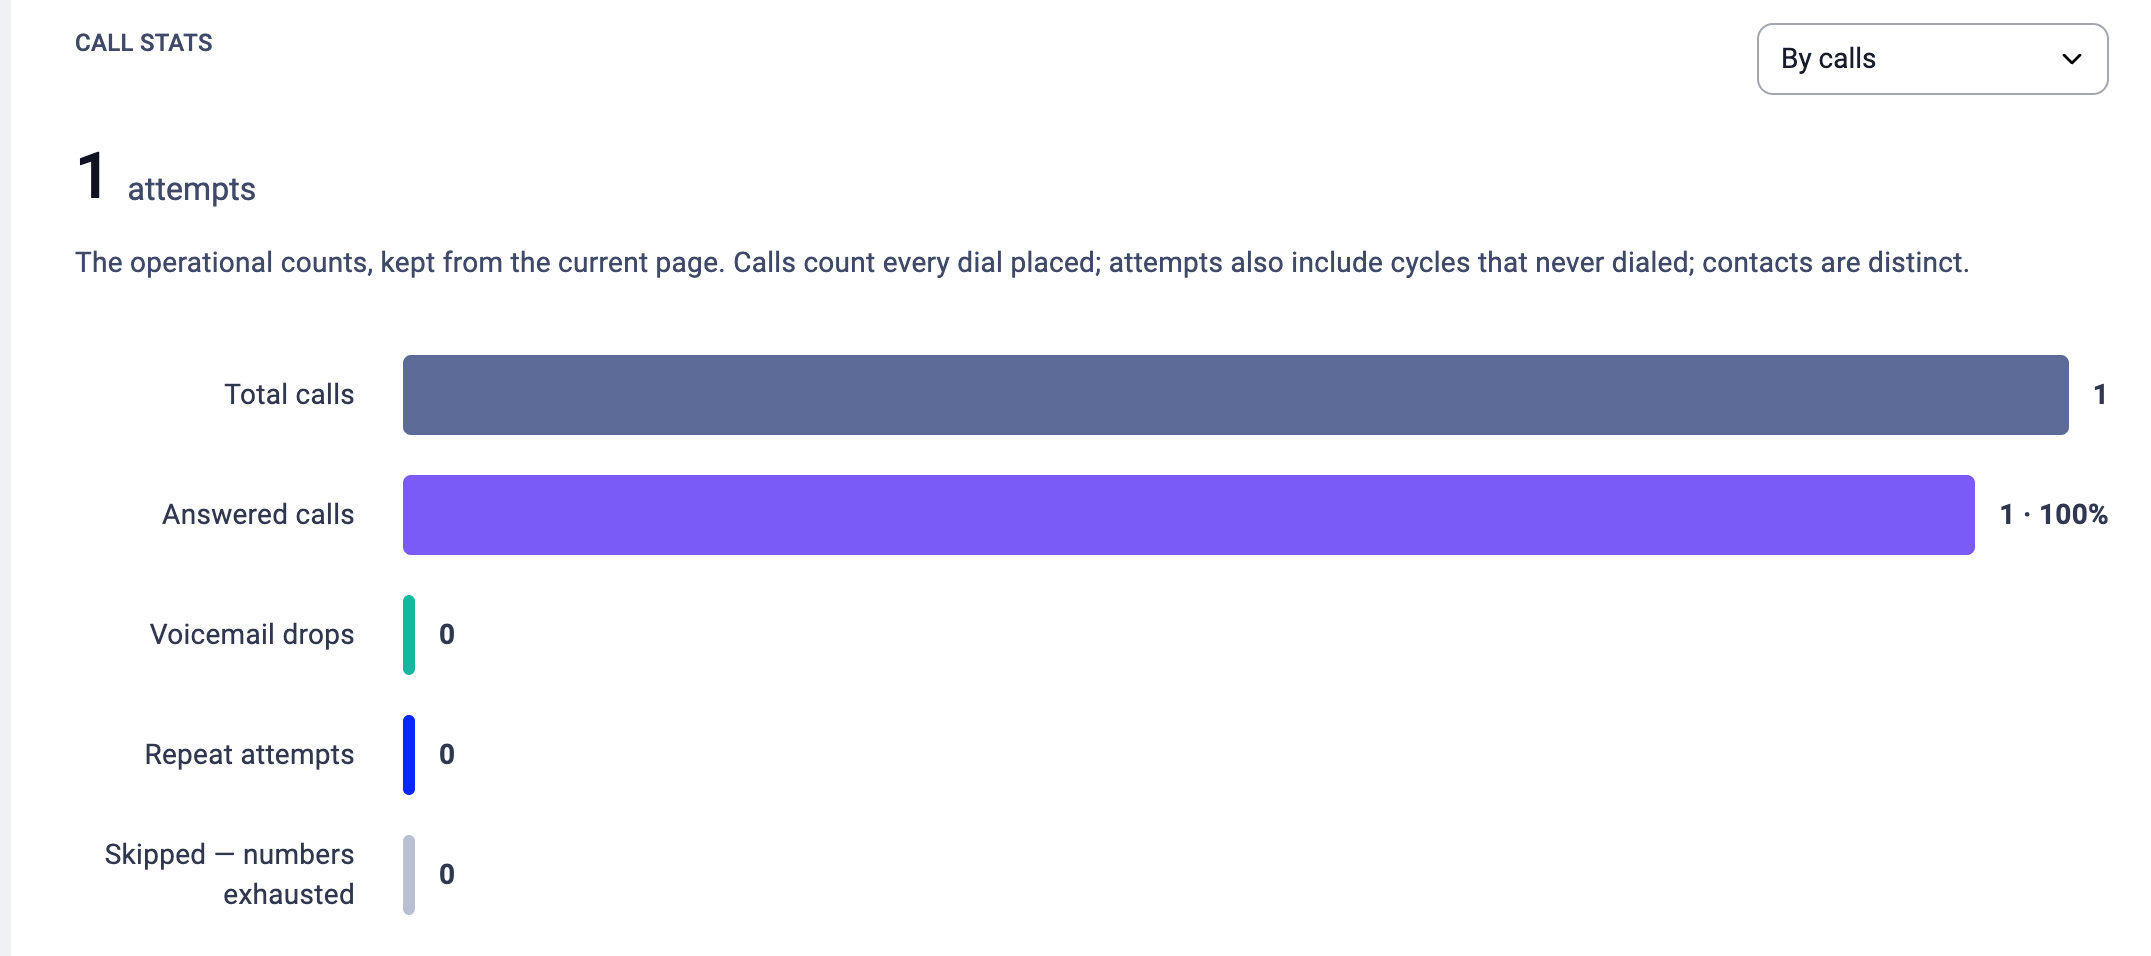
Operational counts for the campaign. A dropdown lets you switch between By calls and other views. Key bars:
Calls count every attempt; contacts are distinct. If you called one contact three times, that’s 3 calls but 1 contact.
Where the time went
A donut chart splitting total time on the phone into Talking and Ringing. The center shows Total calls duration. Use this to understand how much of your agents’ dialing time is productive talk versus waiting for someone to pick up.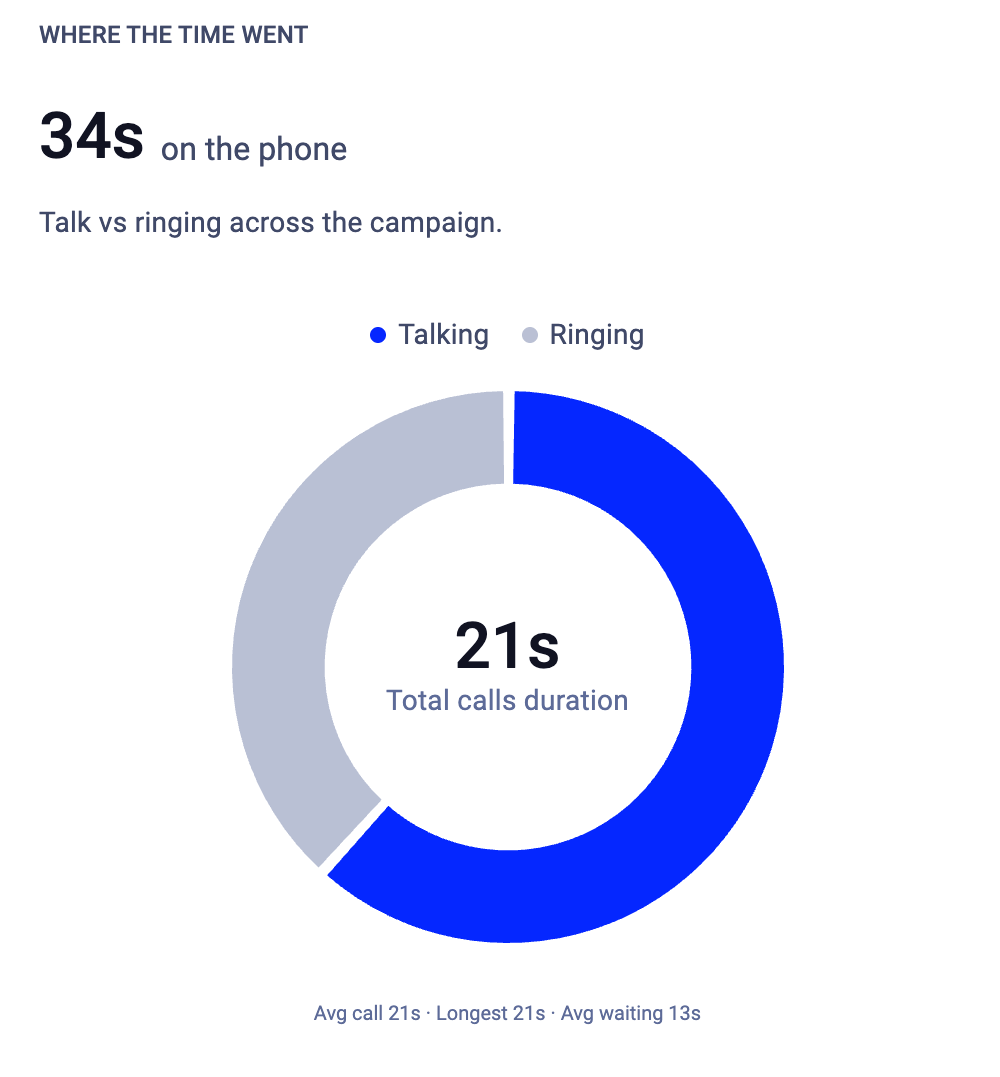
First vs. repeat attempts
Shows what share of your dispositioned calls were repeat attempts versus first tries. Skipped and removed contacts are not included since they don’t carry an attempt number. This helps you gauge how much of your team’s effort goes into retries versus fresh outreach.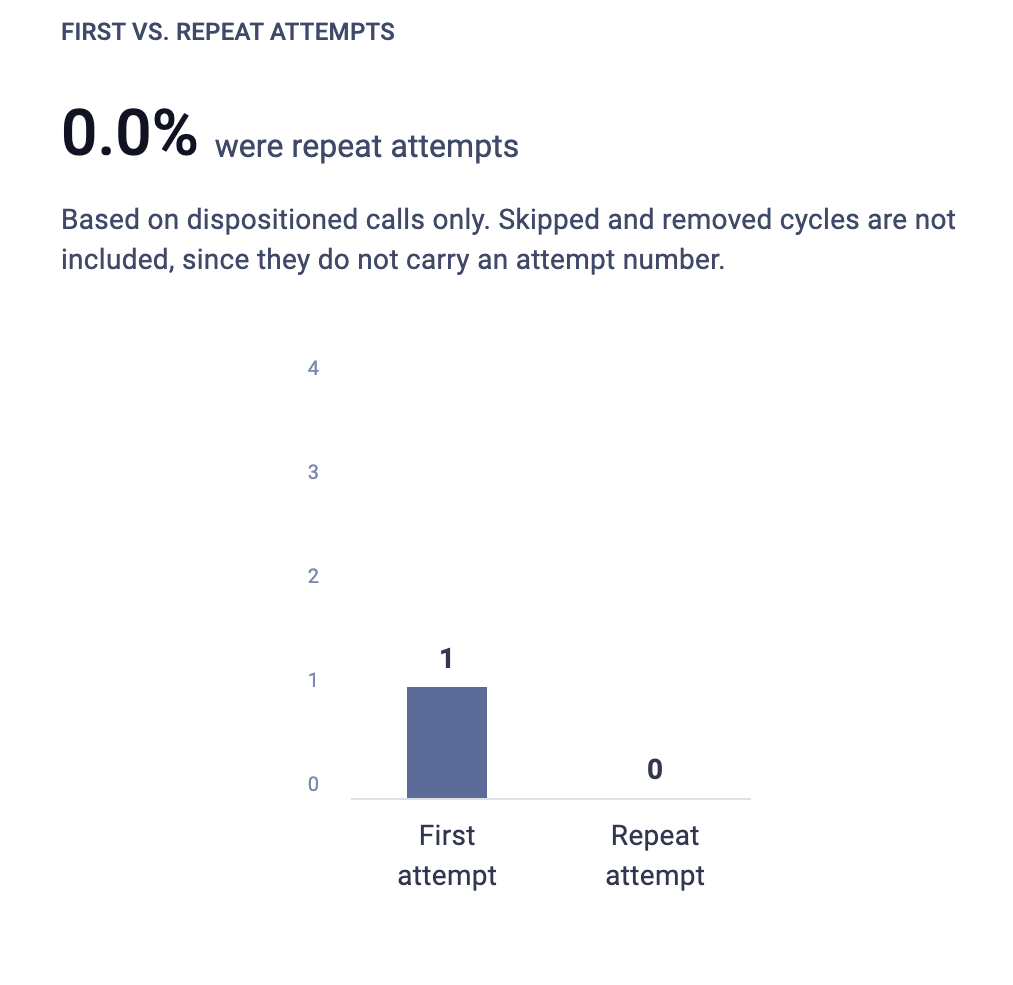
Tabs on the campaign page
Each campaign has seven tabs:- Details. Your campaign’s live dashboard. At the top, a Progress section shows what percentage of contacts are finished, and a bar chart breaks down where every contact sits right now: Finished, Retry, Assigned, or Scheduled. Below that, three cards show Assigned agents, how many contacts are Waiting, and how many agents are Active / assigned. Scroll down for the full Campaign setup summary (all settings, dispositions, script, survey, agent controls) with an Edit campaign button.
- Disposition settings. View and manage the dispositions configured for this campaign. See Dispositions and outcomes.
- Statistics. The metrics described in this article.
- Contacts. A searchable list of every contact in the campaign. Each row shows the contact’s Name and number, their Tag (with a label like “Fresh” or “Retry”), how many Attempts have been made, what’s Next for them (e.g., “Waiting in queue”), and their Owner (the agent assigned to them, if any). Filter by tag to find specific groups.
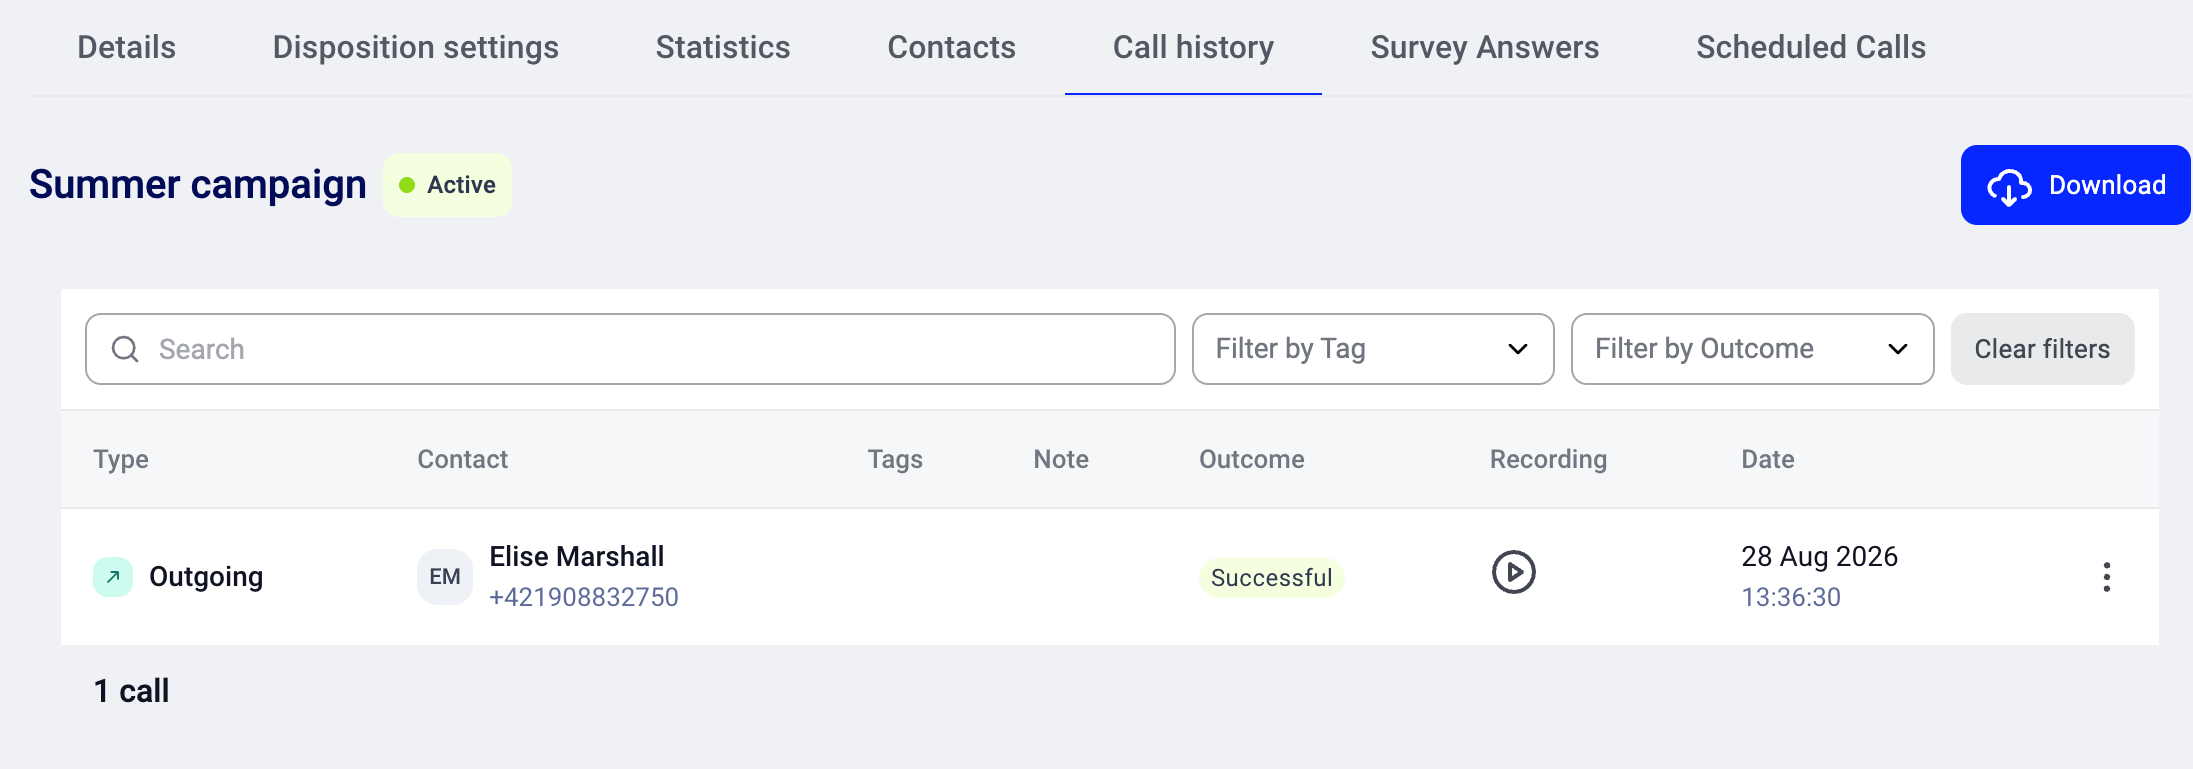
- Call history. A log of every call, described below. Includes a Download button to export call history.
- Survey Answers. All submitted survey responses for the campaign. Includes a Download button to export responses.
- Scheduled Calls. A list of all callbacks scheduled by agents, showing who is scheduled, when, and which agent owns the callback. See Scheduled callbacks.

Call history
The Call history tab lists every call the campaign has made.
You can filter the list by search (free text), Filter by Tag, and Filter by Outcome. Use Clear filters to reset.
Exporting data
You can export call history and survey responses. Each has its own Download button on its tab.- To export call history: open the Call history tab and click Download. The file downloads directly to your computer.
- To export survey responses: open the Survey Answers tab and click Download.
- Type, Status, Contact Name, Contact Number, Agent, Via Call Number, Group, Date & Time, Date, Time, Duration, Category, Call ID, Price, Note, Tags, Ringing time, Talking time, Wrap up time, Call rating, Call rating tags, Outcome
- Empty fields are exported as blank cells.
- Dates use the format “DD. MMM YYYY HH:MM:SS” (e.g., “28. Aug 2026 13:35:26”) in your company’s timezone, not UTC.
💡 The Statistics tab shows aggregate totals. The Call history export includes an Outcome column with the exact disposition for every individual call. Use the export whenever you need per-call or per-contact data rather than totals.
Good to know
- Statistics are per-campaign. Each campaign has its own numbers. There’s no cross-campaign aggregate view in the dialer today.
- Statistics update as agents work. No manual refresh or recalculation step needed.
- Skipped and removed contacts don’t inflate your call counts. They appear in the timeline but don’t bump the dialed, answered, or dispositioned counters.
- Conversion rate uses dispositioned calls as the denominator, not total contacts or total dials. This gives you the truest measure of how conversations convert.
Need help or have a question? Just reach out through our Support portal — we’re here for you.